
Profit analytics

Profit Analytics Software

Your store is making sales. But how much profit are you actually keeping? Northmast brings revenue, product costs, advertising and operating expenses together, so you see what your store earns, not just what it sells.

Built for Shopify, with ad spend from your connected Meta and Google Ads accounts.

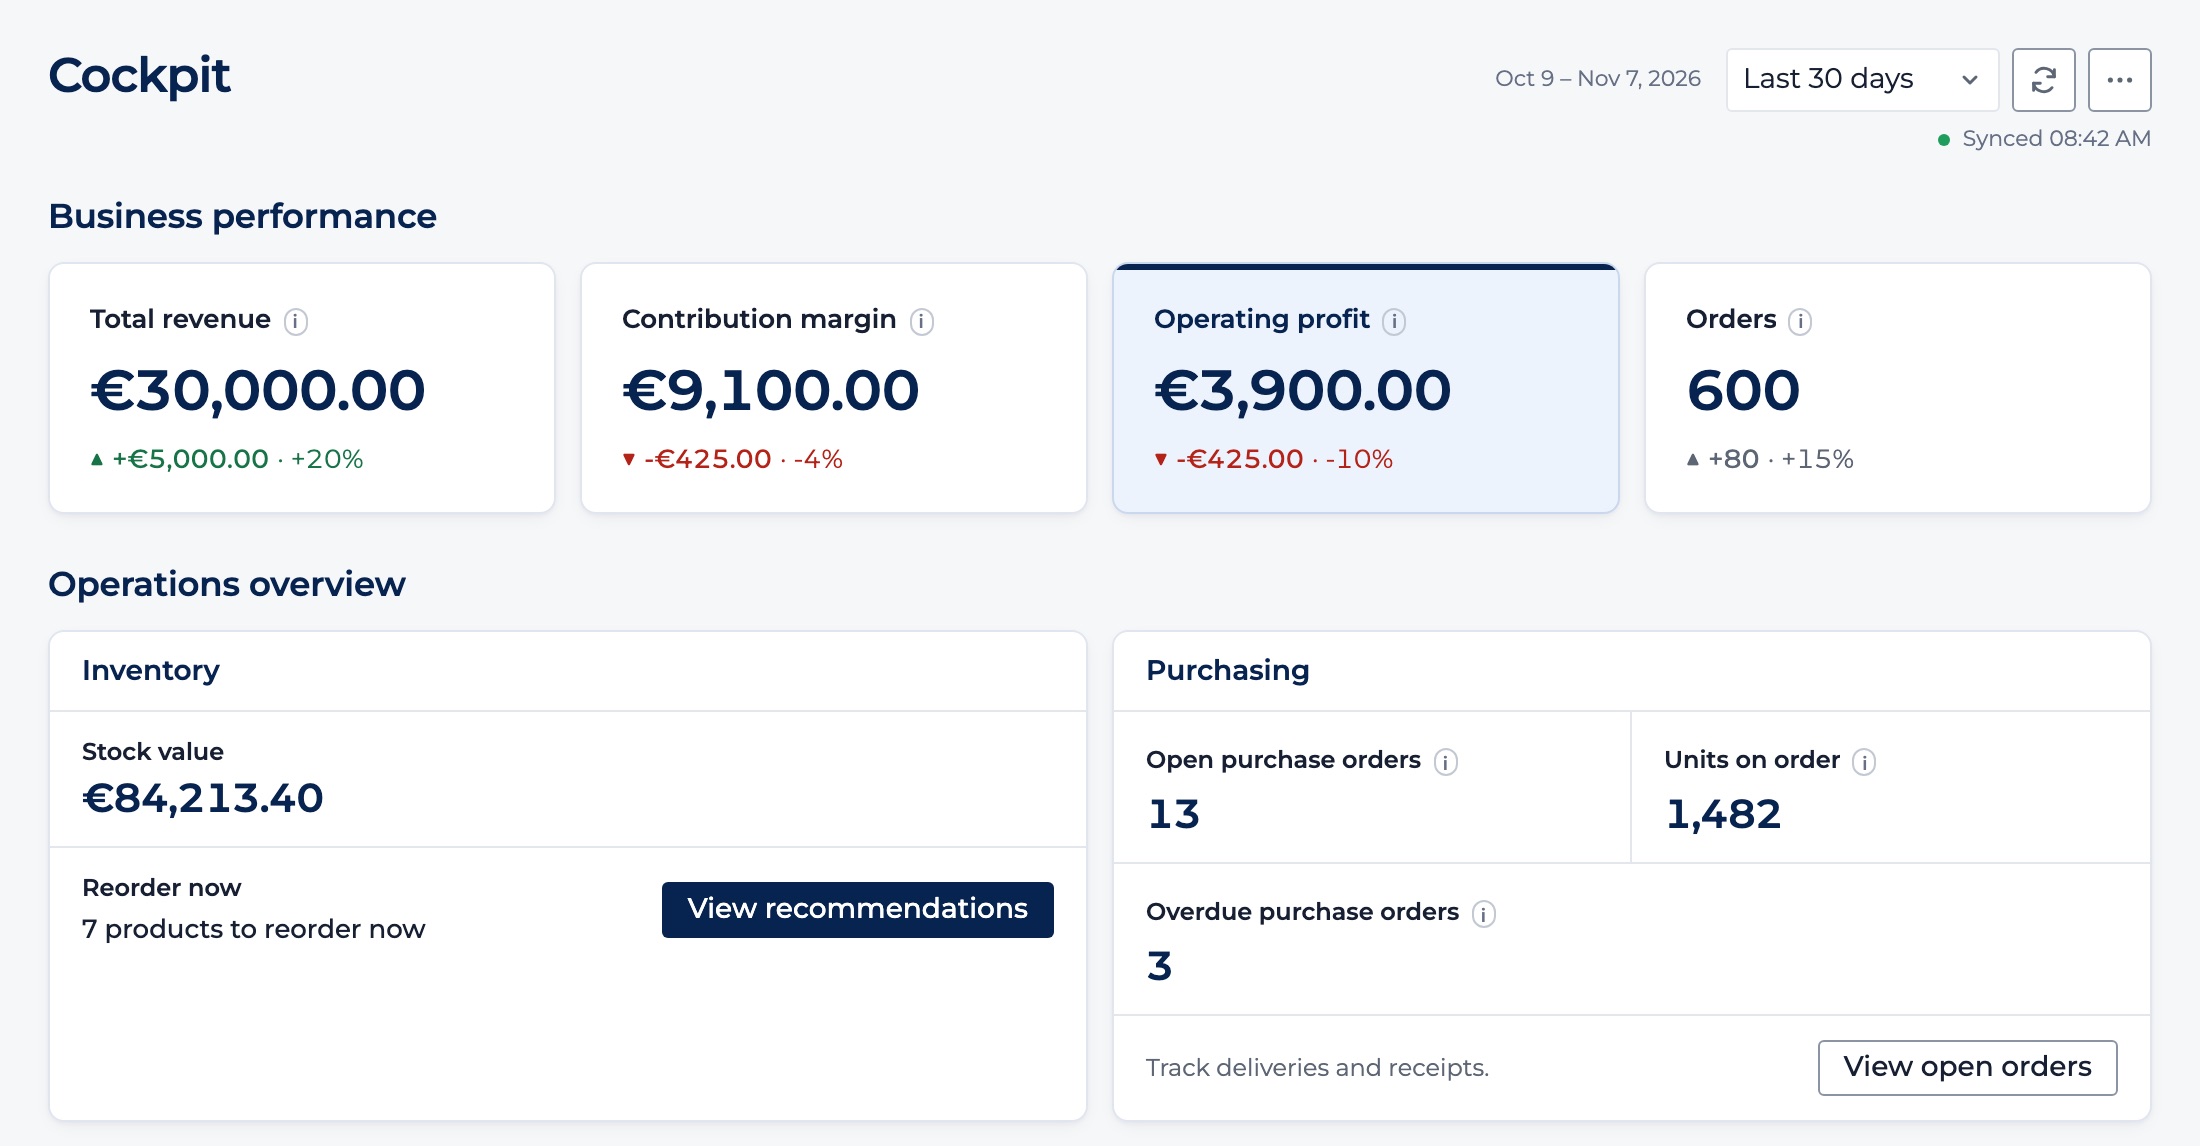
The Cockpit for the last 30 days: total revenue €30,000, contribution margin €9,100, operating profit €3,900 and 600 orders, each compared with the previous period, above the inventory and purchasing overview.
Revenue, contribution margin and operating profit, compared with the previous period.

The problem

Sales are up. So why isn't profit?

Most sales reports stop at revenue, and revenue isn't what you keep. Product costs live in a spreadsheet, ad spend in Meta and Google, payment fees and shipping in separate invoices, and rent and software in your bookkeeping. By the time it's all added up, the month is over, and a record sales month can turn out to be a weak profit month.

What you get

Profit you can see, explain and act on

  • See what your store really earns

    Total revenue, contribution margin and operating profit sit side by side for any period, each compared with the period before. You see at a glance whether growth is turning into profit. Revenue already excludes tax, discounts and refunds, so you start from what you actually earned.

  • Keep product costs in the picture

    Every sale is costed at the cost per item that applied on the day it was sold, so a supplier price increase counts from the day it happens, without rewriting last month. When a product has no cost yet, Northmast marks the figures as incomplete instead of quietly overstating your margin.

  • See what advertising really costs

    Connect your Meta and Google Ads accounts and daily ad spend comes off before your contribution margin. MER shows how much store revenue each euro, dollar or pound of ad spend brings in, so you can see when growth is being bought rather than earned.

  • Count every cost of running the store

    Payment fees and shipping costs are part of your margin. Store-wide expenses such as software, staff and rent are spread over the days they cover, in the currency you pay them in, and converted to your reporting currency. Operating profit shows what's left once the business is paid for.

  • Follow profit day by day

    The Profit sheet shows revenue, costs and contribution margin for every day of the month, so you can find the day margins dropped, not just the month. Your figures export to CSV for your accountant or your own analysis.

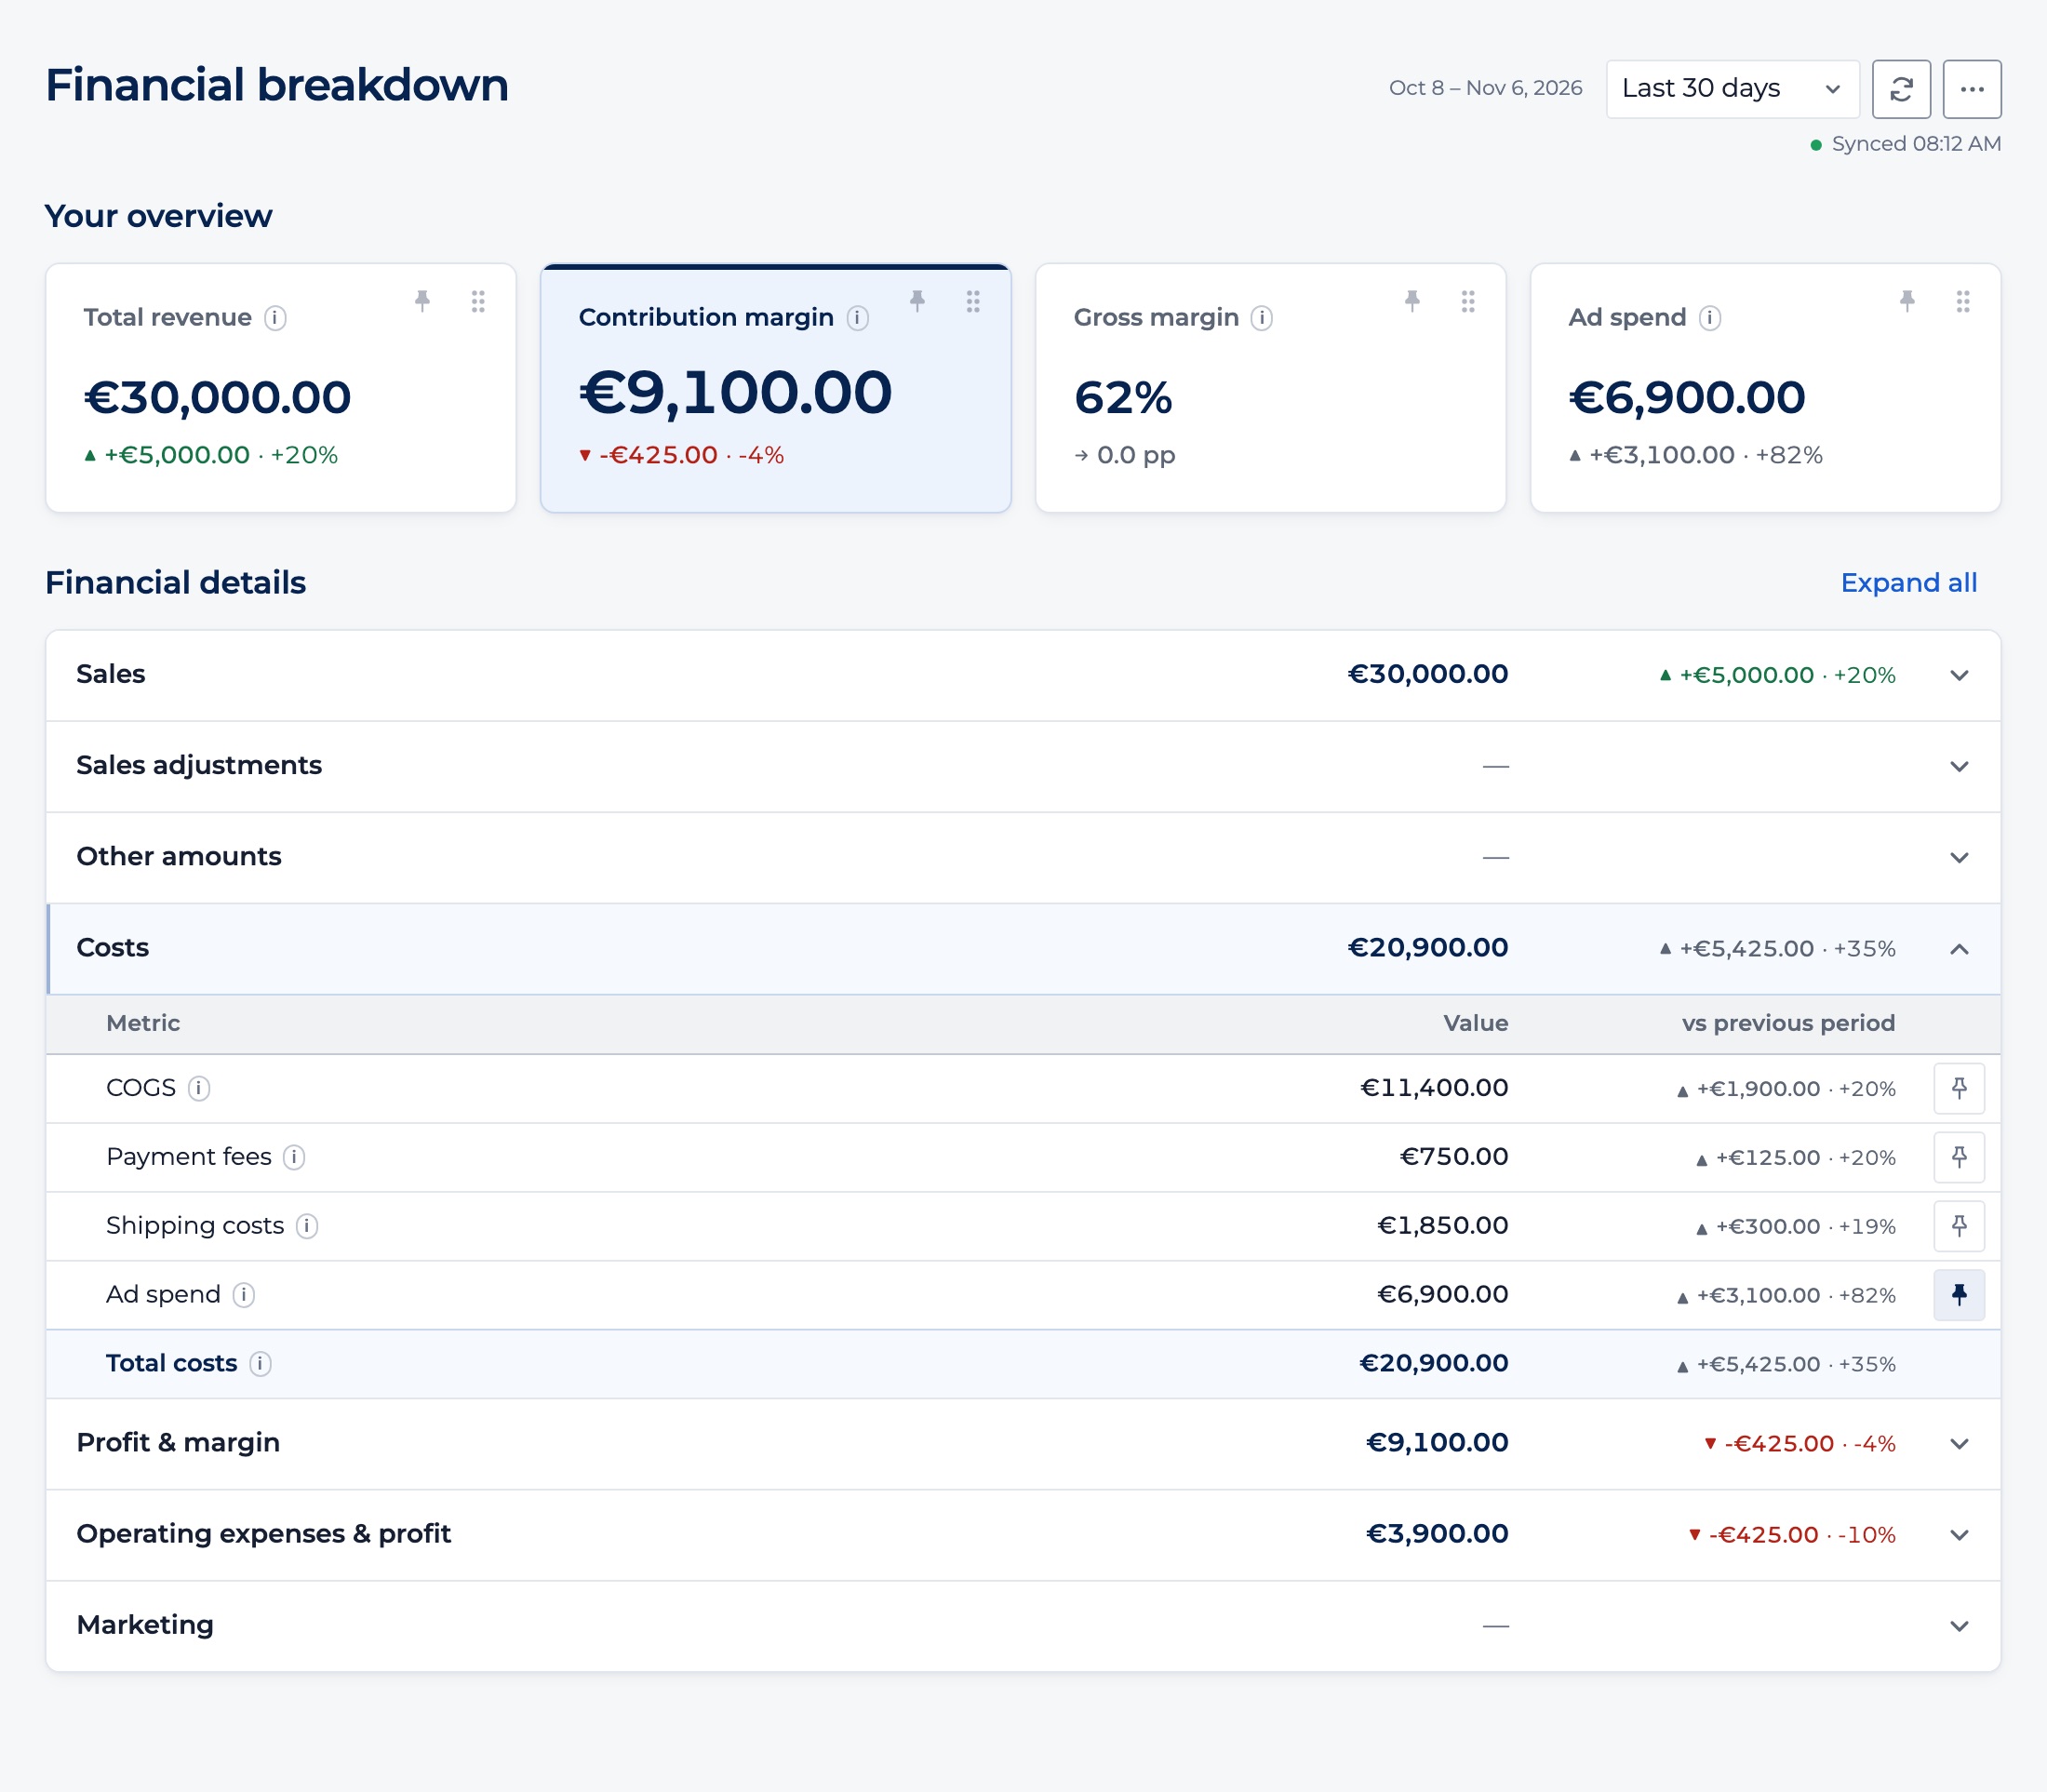
The Financial breakdown: total revenue, contribution margin, gross margin and ad spend, with the cost lines for COGS, payment fees, shipping costs and ad spend.
Every revenue and cost line behind your profit.

In practice

Example: €5,000 more revenue, €425 less profit

A home fragrance brand nearly doubles its ad budget and grows revenue from €25,000 to €30,000 in 30 days. On revenue alone, it's the best month of the year.

Northmast shows the rest. Product costs rose with sales to €11,400, and ad spend went from €3,800 to €6,900. After payment fees and shipping, the contribution margin is €9,100, down from €9,525. Take off €5,200 in operating expenses, and operating profit is €3,900: €425 less than the 30 days before.

The extra €5,000 in sales cost more to win than it brought in. With revenue, margin and profit side by side, the team can see where the money went before deciding on next month's budget.

Illustrative example figures. Revenue excludes VAT, after discounts and refunds.
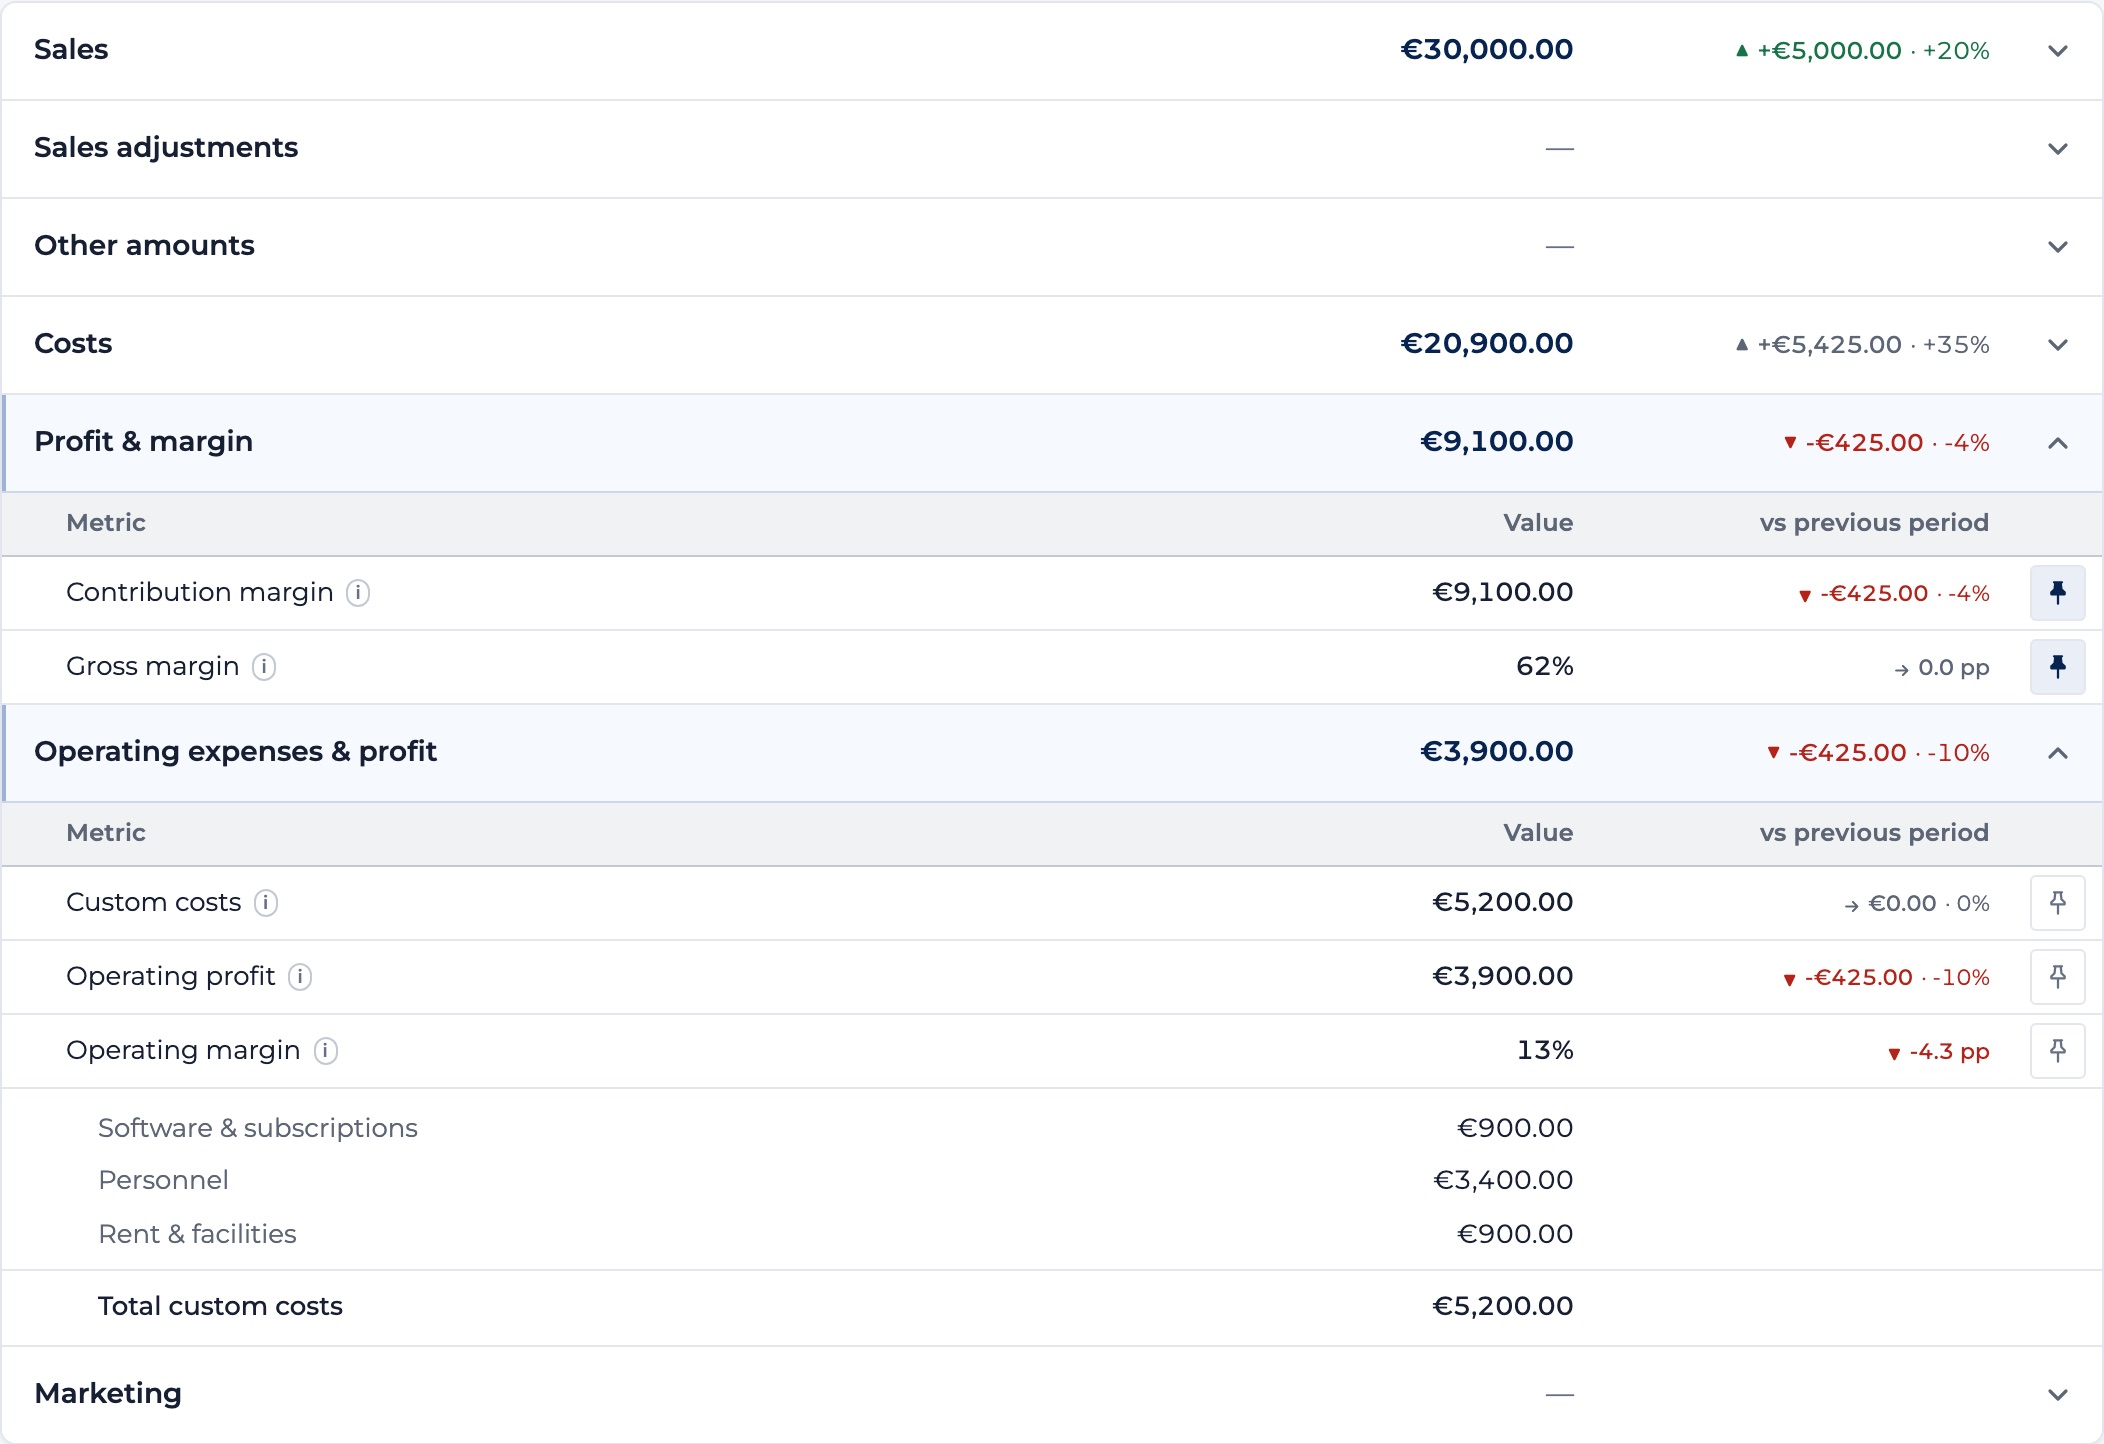
The Financial breakdown from contribution margin to operating profit: contribution margin €9,100, custom costs €5,200 by category and operating profit €3,900.
From contribution margin to operating profit.

One connected app

Profit connected to your stock and purchasing

Northmast isn't only a financial dashboard. Profit sits in the same app as your stock, purchase orders and reorder recommendations, so the numbers behind a buying decision are never in another tool.

  • Stock value next to your profit

    Your daily Cockpit shows revenue, contribution margin and operating profit alongside stock value, products to reorder and open purchase orders. You see what you earn and what's tied up on the shelf in one view.

  • One set of product costs

    Keep product costs connected across profit reporting and inventory valuation, without maintaining separate cost lists.

  • Buying decisions with margin in view

    Keep your purchasing decisions connected to your store's profitability, with margins, reorder recommendations and purchase orders in one place.

Inventory management

Inventory replenishment

Purchase order management

See the full product

Questions

Frequently asked questions about ecommerce profit analytics

What is ecommerce profit analytics?

Ecommerce profit analytics shows what an online store earns after its costs, not just what it sells. It combines revenue with product costs, advertising, payment fees, shipping and operating expenses, and tracks how profit develops over time. Northmast does this for Shopify stores, with revenue, contribution margin and operating profit for any period.

How do I calculate the profit of my online store?

Start with revenue excluding tax, after discounts and refunds, then subtract your costs in layers. Product costs, payment fees, shipping costs and advertising give you the contribution margin; subtracting operating expenses such as software, staff and rent gives you operating profit. Northmast calculates both automatically from your Shopify orders, your cost prices, your ad accounts and the operating costs you enter.

What's the difference between revenue and profit?

Revenue is the money your sales bring in; profit is what's left after the costs of making those sales and running the business. A store can grow its revenue while profit stays flat or falls, for example when advertising or product costs rise faster than sales. That's why revenue on its own says little about the health of an ecommerce business.

What is contribution margin in ecommerce?

Contribution margin is what each sale contributes after its variable costs: product costs, payment fees, shipping and advertising. It shows whether your sales, at their current price and cost level, earn enough to pay for the rest of the business. In Northmast, contribution margin is shown in money and as a percentage of revenue, for any period and for every day.

What's the difference between contribution margin and operating profit?

Contribution margin covers the costs that move with your sales; operating profit also deducts the fixed costs of running the business, such as software, staff and rent. Operating profit isn't net profit, because interest and taxes on profit aren't included. Seeing both shows whether a weak month comes from your sales or from your overheads.

How do advertising costs affect ecommerce profitability?

Advertising is often the largest variable cost after products, so it can turn profitable revenue into a loss. Extra sales from more ad spend only add profit if the margin on those sales is larger than what you paid to win them. Northmast deducts your daily Meta and Google Ads spend before the contribution margin and shows MER, store revenue divided by ad spend, next to it.

Why is my revenue growing but my profit isn't?

Usually because costs are growing faster than sales: more ad spend per order, higher product or shipping costs, more discounts or refunds, or overheads that grew with the team. The only way to know which is to see revenue and every cost layer for the same period, compared with the period before. Northmast puts those side by side, so you can see which cost moved.

Can I track my Shopify store's profit in one place?

Yes. Northmast is a Shopify app that combines your orders, refunds and cost prices with ad spend from Meta and Google Ads and the operating costs you enter. It shows revenue, contribution margin and operating profit in your reporting currency, next to your stock value, reorder recommendations and purchase orders.

Next step

See what your store really earns

Revenue tells you what you sold. Contribution margin and operating profit tell you what you kept. See all three for any period and every day, next to your stock and purchasing.